

Stock Trading Glossary
Table of Contents
- Bond Markets
- Buying the Dip
- Foreign Exchange
- Fundamental Analysis
- Price Action
- Risk Management
- Short Sale
- Speculative Capital
- Technical Analysis
- Trading Range
The stock trading for beginners guide contains detailed information about getting started. But, understanding the definitions used in the stock market is going to improve your trading ability.
Bond Markets
Traders often refer to the different types of bond markets as the debt market or the fixed-income market. Some investors also call it the credit market.
In simple terms, all trades and issuances of debt securities fall under a collective terminology of a single marketplace – called the bond market.
So, why is the bond market important in finance? Well, it provides a way for government entities to issue bonds. Doing so helps them raise capital to fund things like infrastructure projects or to pay off sovereign debts.
Moreover, when publicly-traded corporations issue bonds, they are able to raise extra capital to finance other larger projects, such as for:
- Business development or expansion.
- Expanding product lines.
- The continuation of ongoing operations.
In general, there are two ways for governments and companies to issue bonds. They can make them available through (either):
- The primary market – which means ‘new issues’ end up being rolled out in the form of new debt.
- The secondary market – allowing investors to purchase securities already sold in the primary market. Thus, they can buy packages of pension funds, life insurance policies, and mutual funds through services offered by official brokers and other recognised third parties.
Note: Some investors will buy ‘junk bonds’. Despite offering high returns, this type of investment may present a significant risk for default.
Different Types of Bond Markets
Beginners will find it easier to understand how the general bond market works by segmenting it into five common bond classifications. We highlight the main attributes of each classification.
Corporate Bonds
It is not uncommon for large companies to raise extra money by issuing corporate bonds. As a general rule, they would be longer-term debt instruments (offering a maturity date of at least 12 months).
Emerging Market Bonds
The governments and companies in emerging market economies (e.g. South America, parts of Asia) also issue bonds to raise capital.
From an investment point of view, they often provide greater opportunities for growth. But, they tend to be riskier than those available in domestic or traditional bond markets.
National-Issued Government Bonds
There are several reasons why government bonds (also called Treasuries) will be the preferred choice for many long-term investors. They pay out the face value (e.g. an amount listed on the bond certificate) at the point of maturity (e.g. after 10, 20, or 30 years).
Because they also issue periodic interest payments until they reach the maturity date, this type of bond tends to entice even the most conservative of investors.
Mortgage-Backed Bonds
This type of issuance combines pooled mortgages on hard assets like real estate properties. The pledge of particular collateralized assets locks in the bond and usually offers monthly, quarterly, or even bi-annual interest payments.
Municipal Bonds
The issuance of so-called ‘muni’ bonds is an accepted way for government-owned entities (e.g. public utility districts, school districts, and publicly-owned airports) to raise additional cash for the funding of localised projects.
All trades and issuances of debt securities fall under the collective terminology of a single marketplace – called the bond market.
Note: The main section contains more advice and information about stock market trading as a business and how to invest in individual equities.
Buying the Dip
Investors and traders who use the ‘buy the dip strategy’ will be trying to purchase an asset when its price has declined. Even so, there are several important concepts to understand when buying pullbacks.
For Example:
Traders who are buying dips as an asset drops during a long-term uptrend will be hoping that the uptrend is strong and will resume its bullish trend after the drop.
Whereas, others will still use the same trading strategy even if there is no uptrend. In most cases, they will be hoping that an uptrend is going to occur at some point in the future (e.g. as and when the market rebounds).
Either way, the rationale behind the ‘buy the dip’ game plan is to jump in when the price drops to set up potential profits on future price rises.
Buy The Dips Strategy
Asset prices can only move in three directions – up, down, or sideways. However, when they drop from a higher level, it presents an opportunity for traders to buy (or add to existing positions).
However, it’s important to emphasize that buying a dip does not guarantee future profits. There are many reasons why assets drop in price. Hence, buying instruments when they are cheaper is not a guarantee of holding good value.
Example Strategy for ‘Buying a Pullback’
A trader tracks a stock (e.g. one of the tech stocks) as it falls from $99 to $79. Even though it might be a good buying opportunity, he is also mindful that it may not be the best time to enter the trade.
The thing to try and determine is why the stock dropped in the first place. Is it because:
- There was a change in earnings.
- The growth prospects look challenging.
- A new management team is in charge of the company.
- Are the economic conditions looking bleak?
- Did the company lose a big contract?
The point we make is that stock prices can continue dropping – down to $0 in really bad situations. Thus, proper risk management should be part of every trader’s repertoire.
Controlling Risk when Buying the Dip
Buying dips can be a profitable approach to use when stocks are in long-term uptrends. But, dip buying can also be unprofitable (or more challenging) when stocks are trending downward.
As a result, having a policy that controls risk should be part of all investment methodologies and trading strategies.
Why?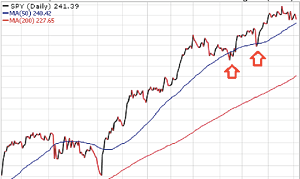
Because, traders and investors who buy instruments after they have fallen need some way of controlling, or reducing, the risk.
After all, what other action is available to stop the price dropping to zero?
The image shows the upward trend of an asset. The two arrows highlight the areas where the dips or pullbacks occurred.
Even so, the price made a higher low and a higher high. Thus, it provides some confirmation that the uptrend is still intact.
Note: The price action will have entered a downtrend if it starts to make lower lows. Hence, the price gets cheaper as a lower low follows a dip. Holding onto a losing asset comes with a high level of risk. As a result, most traders avoid buying dips when stocks are trending downward.
Foreign Exchange
The two commonly used abbreviations for Foreign Exchange are Forex and FX. Simply put, acts of trading from one currency to another are the main activities carried out in Foreign Exchange markets.
Here’s a good example:
A typical foreign exchange transaction is swapping U.S. dollars for Euros. This interchange takes place on a daily basis through the Forex Market (also called the foreign exchange market).
Thus, it is a global marketplace where dealers exchange national currencies. It is by far, the most usable (i.e. liquid) and largest market in the world (by nominal value).
Trillions of dollars (a trillion is one thousand billion) change hands every day in foreign exchange venues. Yet, there is no centralized location. Instead, the electronic network includes an array of entities, such as:
- Banks
- Brokers
- Individual traders (trading through banks and brokers)
- Institutions
Note: Dealers use currency pairs priced versus each other (e.g. GBP/USD) in foreign exchange trading. Another way of participating in the forex market is with forwards and futures.
How Does Foreign Currency Exchange Work?
The value of most currencies, also called the exchange rate, is determined by the market. Hence, when changing one currency for another (e.g. at a bank) you are completing one of the simplest foreign currency exchange transactions.
That said, some of the more complex undertakings will involve currency trading on the foreign exchange market.
An example would be a trader betting that a central bank is going to change (e.g. ease or tighten) their monetary policy. In this case, one currency is more likely to strengthen (i.e. increase in value) versus the other one.
It is important for people who are trading currencies that they will be listed in currency pairs, such as:
- USD/CAD (represents the U.S. dollar versus the Canadian dollar).
- EUR/USD (represents the Euro versus the U.S. dollar).
- USD/JPY (represents the U.S. dollar versus the Japanese Yen).
Foreign currency exchange transactions (e.g. USD to Euros) are some of the common daily interchanges that take place through Forex Markets.
Fundamental Analysis
Determining the real value of a stock (e.g. its fair ‘market value’) is an important part of Fundamental Analysis (FA). It is one method used to measure the intrinsic value of different securities.
Hence, fundamental analysts research and examine key economic and financial factors related to a stock, before deciding whether to make the investment.
In most cases, part of the research carried out by all analysts will include things that are likely to affect underlying values, such as:
- Macroeconomic factors (how the economy is fairing, industry conditions).
- Microeconomic factors (does the company have an effective management team, financial statements).
Simply put, the role of a fundamental analyst is to identify stocks and securities that are trading at prices above (or below) their real value.
Key takeaway:
The main objective when using Fundamental Analysis techniques is to determine whether current pricing is overvalued or undervalued.
Hence, a stock would be ‘undervalued’ if the fair market value is higher than the market price. So, in this situation, instigating a buy would be the recommendation from most stock analysts.
Note: This method of stock analysis differs from the techniques used in Technical Analysis (TA). In most cases, analyzing the historical market data of a stock (price and volume) helps to forecast the direction of prices.
Fundamental Analysis vs Technical Analysis
In stock trading, technical analysts tend to ignore the traditional fundamentals. Instead, they will place a higher level of importance on studying historical price trends within broader markets.
As such, Technical Analysis (TA) focuses on the general state of the economy, closely followed by the strength of a specific industry. Hence, concentrating on the performances of individual companies tends to gain lesser importance.
In case you were wondering:
You need to gather a certain amount of public data when evaluating stock values (or any other types of securities).
A typical example would be an investor using a range of fundamental analysis tools to evaluate stocks in the bond markets. The most important economic factors would be:
- Interest rates.
- Information about the bond issuer (e.g. its credit rating and any potential changes to it).
- What state the economy is in (e.g. recession).
Some of the basics that you will need to determine from a company financial statement when analyzing the fundamentals for stock value, is:
- Earnings
- Future growth potentials
- Profit margins
- Revenues
- Return on equity
Note: You are more likely to use fundamental analysis (FA) for stock valuations. Even so, evaluating the broader economy, along with company details, is a useful part of risk management for any security, as well as bonds and derivatives.
Analyzing Stocks Using Fundamental Analysis
The short video [10:03 minutes] explains how to analyze a stock using the fundamentals. Thus, you can determine what stocks to buy through qualitative and quantitative analysis.
Price Action
There are several ways to define price action in trading. But, understanding the basics, along with other common trading terminologies associated with it, is an integral part of a journey in investing.
So, what do stock traders mean when talking about price action? Investopedia (considered as being a leading source of financial content on the web) describes it quite simply as:
Note: “The movement of a security’s price plotted over time (e.g. the up and down movement of price structures).”
Let’s look a little further.
You will need to use some form of technical analysis to make any worthwhile conclusions about the way prices are moving. This strategy applies in all cases, no matter what instrument you are tracking (e.g. stocks, Forex, or commodities).
That being said, there are several ways to interpret different kinds of price action charts. Hence, some price trends are simpler for beginners to understand and use when reading the markets.
The main benefit of understanding what price action is telling you is being able to combine it with other technical charts and formations.
An Example:
The most common trading tools (e.g. moving averages) use lagging price action to project future trends. So, the decisions that most short-term traders will make derive from previous price action indicators.
What Do Traders Learn from Price Action Patterns?
Traders and investors use a variety of charts to interpret price action. The primary role of stock charts is being able to plot and track price swings over differing periods of time.
Here’s how it works:
Even though there are many different chart compositions, some are used more commonly than others. Yet, almost all of them allow traders to identify:
- Breakouts
- Market trends (bullish or bearish momentum)
- Trend reversals
The vast majority of traders will use candlestick charts to help them spot trends and reversals in up and down sessions. Thus, you will see price movement as a general direction of the values.
Note: Candlestick chart patterns display the opening, the highest, and the lowest price values for any given session (e.g. hourly, weekly, monthly).
Using Japanese Candlestick Patterns
Stock traders use three key Japanese candlestick formations to help visualize and interpret price action. A critical part of risk management is understanding how bullish reversal, bearish reversal, and continuation patterns work – and why they occur.
Other popular candlestick patterns include:
- Engulfing
- Evening star
- Hammer
- Harami cross
- Three black crows
- Three line strike
- Three white soldiers
Some traders, and most technical analysts, also use other kinds of price action data besides the visual formations on charts. The aim is to rationalize momentum and direction in what can appear to be random movements in prices.
Here’s a good example:
Applying trendlines (e.g. straight line indicators) to a price action chart could form an ascending triangle or descending triangle pattern.
Why is this important? Because, often it predicts a potential breakout. In short, this kind of price action indicates that either the bulls or bears are taking charge.
In short, it means the bulls or bears attempted a breakout on numerous occasions and gained upside or downside momentum on each occasion.
What is Meant by Price Action Trading?
The short video [13:45] explains more about how price action trends and calculations are useful sources of information when making trading decisions.
Risk Management
As an active trader, using the best risk management techniques will help you to reduce financial losses and avoid losing large amounts of money.
Managing risk is an essential skill that all successful traders will have mastered at some point or other. Furthermore, generating substantial profits in social trading will be a short lived experience if they are lost in a single bad trade.
In simple terms, continued use of proper risk management strategies means you have developed good trading techniques. These skills are going to help you control some of the major upside and downside risks in the markets.
How to Use Risk Management Strategies
Here are some simple risk strategies that beginners can use to protect gains and secure trading profits: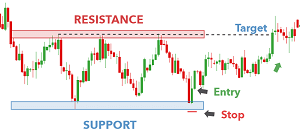
- Always try to stay focused on the goals, employ due diligence, and try not to become too emotional. Most professionals say that trading should be a ‘boring’ activity – not an exciting one!
- Incorporating risk management practices (e.g. placing an appropriate stop loss level, portfolio diversification). Doing so will help to prevent losses getting too big and out of control.
- The best traders will have developed a strategic and objective approach. It helps them manage emotion and ‘stay in the game’ longer, by:
- Determining risk, exposure, and reward.
- Taking some profit off the table.
- Using stop orders to reduce large losses.
Key Takeaways about Managing Risk
Develop a sustainable strategy for entering and exiting trades before executing them.
Effective stop losses reduce premature exits and help to minimize financial loss.
Never overlook the importance of using proper risk management strategies. They are some of the core components needed to be a successful trader.
Short Sale
Short selling, also called a short sale, is somewhat of a contrarian way to make money from the stock market. Thus, going short, means a trader is selling an asset or a stock that they do not actually own.
So, why would you make a short sale as a trader or investor? Well, the only reason you would go short is if you think the value will decline at some point in the future.
Here’s how it works:
Despite being a risky strategy for beginners to undertake in stock market trading, short selling is quite a simple concept to explain. In fact, we can define a short sale in three steps:
- You ‘borrow’ an instrument (e.g. Apple stock).
- Set up a short sale (e.g. sell the stock).
- Buy the stock back after it declines in value and return it to the lender.
Simply put, traders borrow stock for a specified time on margin to accomplish short sales. Exiting the trades will take place when they sell them and return them to the lenders.
In general, this type of transaction means the investor is selling securities that are borrowed – and not owned. Even so, the seller would need to return the same number of shares back to the lender – at some point in the future (e.g. following a price decline).
Note: Contrastingly, the seller would be the owner of the security or stock. Thus, they would be taking the long position.
Short Selling Explained for Beginners
There is one distinct advantage gained from a performing short sale. It allows traders to make a potential profit when asset prices are dropping.
So, why is short selling risky?
Having a good risk management strategy is super important when executing short sales. Why? Because, theoretically there is no limit to possible losses (e.g. price action turns to the opposite direction and it continues rising).
Moreover, some regulatory risks accompany short selling strategies. Traders rarely make short sales work successfully without having near-perfect timing in the markets.
Using a stop-loss order is a familiar technique used by short sellers. The stop loss would automatically cover the trade, and help to minimize losses, if the stock price starts to rise.
Using simplified terminology, going short in trading means you are selling an asset or a stock that you do not actually own.
Speculative Capital
The allocation of specific funds, for the exclusive purpose of speculation when trading stocks, is one way of defining speculative capital. Simply put, you would be earmarking capital for investments considered as high risk – with high reward potentials.
Even so, this kind of capital speculation often finds its way into stock markets that are extremely volatile (e.g. Cryptocurrencies). As a direct result, the probability for loss is high!
Contrastingly, patient capital (called long term capital) refers to specific funds intended for investments that will mature over a longer timeframe (e.g. years… not days).
Furthermore, the definition of risk tolerance varies significantly among investor archetypes. So, choosing how to allocate funds, and for what period of time, will depend largely on your financial goals.
Key takeaway: Speculative capital.
There are several obvious dangers for speculators with short-term investment horizons. One of the most common risks that beginners take is using a high degree of leverage. They often see it as a concerted effort to obtain maximum profits.
Speculative Capital and Social Trading
We already established how the probabilities of generating large losses are above average when trading speculatively (e.g. in a volatile market). So, exercising good risk management techniques is critically important – especially for novices.
Here’s the truth:
It is far too easy for beginners to get ’emotionally’ attached to trades. In fact. I did it myself when I was learning how to trade stocks online.
As a result, novices with limited experience often hold onto speculative positions to a point where they lose far too much of their values. This can be a dangerous flaw, and have big consequences, when short selling assets.
Imagine this:
Supposing you are one of the rookie traders who want to start copy trading on one of the digital trading platforms. If so, treating all your tradable finances as speculative capital can be an effective way to trade.
Tip: Consider investing an amount of money that you can afford to lose. And… it wouldn’t have a serious affect on your way of life if you lost it all.
Identifying Capital for Speculation
Looking at it another way. What is a good method for identifying funds you would feel quite comfortable speculating with – and still sleep soundly at night?
As an investor or trader, you should try to determine an amount (big or small) that you are willing to lose. Moreover, losing it should not jeopardize your plans for further investments and financial gains.
In practice, investors are speculating with money, to some degree, any time there is a possibility for loss. For example, Treasury Bills are virtually default-free. Yet, you may consider government T-bills as speculative in nature (e.g. inflation is the speculation).
Simply put, speculative capital refers to funds that investors set aside for the sole purpose of speculation (e.g. making high risk/high reward investments).
Technical Analysis
The simplest definition of Technical Analysis is an attempt to determine the location of buyers and sellers in the market. The level that buyer’s are unable to break is Resistance. Whereas, the level that seller’s cannot break is Support.
Put another way…
Resistance is a zone where sellers are waiting to make a ‘short sale’. Hence, Support is an area where buyers are waiting to ‘go long’ (e.g. buy commodities, stocks, and shares).
Note: The video contains basic information about analyzing an asset (e.g. in Foreign Exchange markets).
Does Technical Analysis Predict Price?
No. Predicting asset prices is not the main function of this kind of trading discipline. Instead, we use it to evaluate investments and to seek out trading opportunities. In short, it helps us identify ‘when to place a trade’.
As a result, charting offers possibilities… not certainties. So, the price trends and patterns that we see on trading charts can help us to determine:
- The overall risk of a trade.
- A direction to the path of least resistance.
- Historical trading data.
- How to time a trade (e.g. entry points).
- Short-term price movements.
- Weighting, volatility, and volume.
- Statistical trends (e.g. bullish or bearish).
Most technical analysts place a heavy weighting on past trading activities and changes to prices. Thus, understanding the principles of these valuable indicators can help you identify future price movements of securities.
Technical Analysis vs Fundamental Analysis
Now you know that technical analysis focuses on price and volume. So, why do traders need to learn about Fundamental Analysis as well (e.g. the financials)?
It’s important to evaluate the value of a security. Thus, the fundamentals of any business, large or small, relate to its trading results (e.g. earnings, sales).
The key takeaway:
Stock traders use many different charting tools to help generate short-term trading signals. So, these indicators also help to evaluate the strength (and the relative weakness) of any security (e.g. Tesla stock).
Being able to identify the technical fundamentals in a broad market, or one sector, helps stock analysts improve their estimations when making comprehensive valuations.
Trading Range
The importance of understanding what a trading range is should never be underestimated. Hence, the significance of range bound trades (e.g. making constant and repeated highs and lows) can help you identify zones of risk.
So, what exactly is the meaning of a ‘trading range’? It refers to any security (e.g. currency pairs) that trades between high and low prices with consistency, and some degree of predictability, for a significant period of time.
Let’s start with the basics:
Time and again, tops and bottoms of trading ranges provide traders with invaluable information for their risk management strategies.
Example
- Often, the top zone or ceiling of range bound action turns out to be some form of price resistance. As a result, this offers an area for shorting (e.g. selling the security).
- Conversely, price support usually occurs at the bottom of a trading range. In this case, traders are more likely to go long (e.g. buy an asset).
It’s also important to understand when to enter a trading range – and then exit it. The common indicators used for this purpose are price action and volume.
Understanding Range Bound Trading
There are two kinds of momentum in social trading (positive and negative). Strength is likely to build as stocks break through the upper zone (resistance) or fall through the support line.
Put another way:
Some traders will be looking for a breakout as prices move to the upside of a trading range. Even so, it is also important to be able to identify a breakdown if the price drops below its range bound action.
Breakouts and Breakdowns
Even though breakouts and breakdowns are regular occurrences, reliability increases when either of them is accompanied by large volumes. Generally, widespread participation by institutional traders and large scale investors will result in increased volume.
Another important factor to consider is trading range duration. Simply put, an extended period of ranging action (e.g. moving sideways inside a channel) is likely to be a sign of an impending and significant trending move to the upside or downside.
Note: A frequent tactic used by day traders takes place at the beginning of a new trading session. They use the trading range as extra guidance for intraday strategies (e.g. buying stocks as they break above opening trading ranges).
Top Trading Range Strategies for Beginners
Being able to identify securities that are trading in price channels will help you capitalize on any potential breakouts. Hence, this is one of the trading strategies that takes advantage of range-bound trading.
How does it work?
The first step is to find major support and resistance levels on a trading chart. The easiest way is to use horizontal trendlines to identify the upper and lower zones and connect them together.
Professional traders will buy a security near to the lower trendline support located at the channel floor. By contrast, they will sell (e.g. make a short sale) at the upper trendline of a channel.
Trading range refers to a security that trades between high and low prices with consistency, and some degree of predictability, for a significant period of time.
Note: It is important to confirm overbought and oversold conditions as the stock price oscillates inside trading ranges. The commodity channel index (CCI), relative strength index (RSI), and the stochastic oscillator are common technical indicators used for this purpose.
Related Help Guides
- How to become a professional stock trader?
- Cryptocurrency trading for beginners.
- What is Copy Trading and how can I copy experts?
Note: The index section lists key details about business and finance regulations in Great Britain (England, Scotland, Wales) and Northern Ireland.